
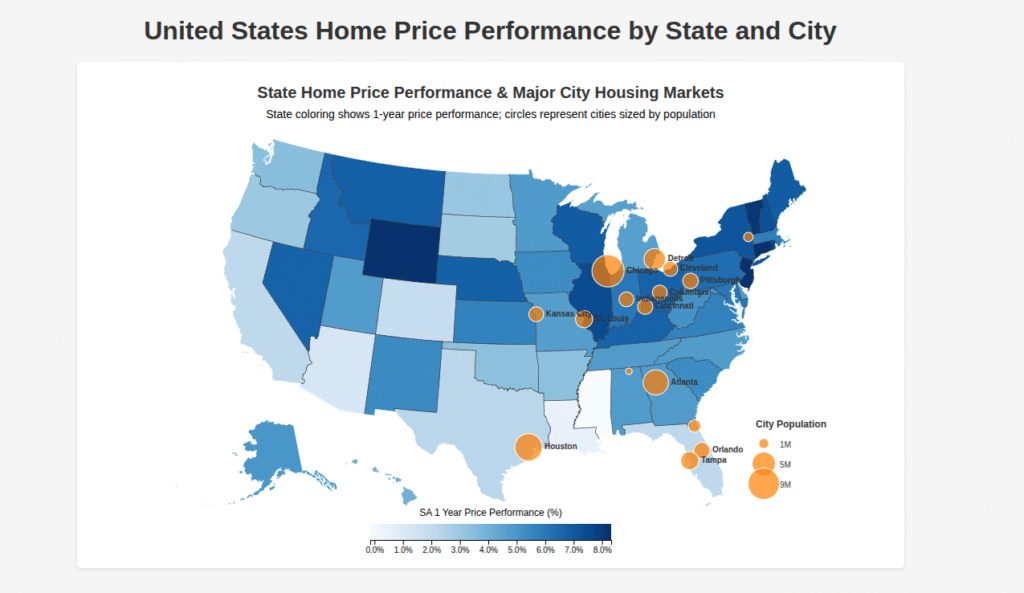
The U.S. housing market overview by state and major city using two layers of information: one for states (colored by price performance) and one for cities (sized by population). Here’s what each part of it means:
🗺️ Map Overview:
🔹 States (Color-Shaded by 1-Year Home Price Performance)
- Each U.S. state is shaded according to how much home prices have changed over the past 1 year (seasonally adjusted).
- Color scale typically ranges from cool (e.g., light blue = low or negative performance) to warm colors (e.g., dark red = high appreciation).
- This helps you spot hot or cooling housing markets at a glance.
🔹 State Metrics Include:
- SA 1 Period: Seasonally adjusted performance in the most recent reporting period.
- SA 1 Year: Seasonally adjusted 1-year performance (main metric shown by color).
- SA 5 Year: Seasonally adjusted 5-year performance (longer trend).
- SA Since 1991: Historical performance from 1991 to now—useful for big-picture context.
🏙️ Cities (Circles, Sized by Population)
- Cities are plotted on the map as circles.
- Circle size = City population — larger cities have bigger circles.
- This allows you to compare urban housing markets within the broader state context.
📊 City Data Includes:
- Population
- Median Home Price
- Median Rent
- Household Income
- Job Growth Rate
- Unemployment Rate
These metrics give you insights into affordability, growth potential, and economic conditions in each city.
📌 How to Use This Visualization:
- Hover over a state to see recent price performance metrics.
- Hover over a city circle to see economic and housing details.
- Compare states and cities to identify investment opportunities, growth zones, or affordability risks.
🔗 Your VizHub Project Link
Link: State & City Housing Map – VizHub
You can use this visualization to:
- Embed it in a blog post or real estate site
- Present state vs city trends visually
- Help readers or clients understand housing market dynamics quickly